Alumni

Bio
Amelia is currently studying a master’s of marine science at the University of Tasmania with a focus on the development of volcanic atolls near Papua New Guinea. She is simultaneously studying a Diploma of Education to teach high school students. Coming from a background in geography, with first-class honors in climate change adaptation for floating house communities in Cambodia, Amelia has a wide range of academic interests and has used a systems approach to analyze a number of human and physical geographical problems. Alongside research, one of Amelia’s other passions is science communication, and she has been the primary communicator during a number of research expeditions in the Arctic, and is looking forward to the challenge of communicating a bit of NKS. In her spare time, Amelia likes knitting and swimming near her hometown.
Project: Using image analysis to identify and investigate the patterns of land use change
The purpose of this project is to systematically analyze the shape and patterns of wildfire landscape scars globally using remotely sensed, satellite imagery. Satellite imagery of varying resolutions has been collected from the US Geological Survey and NASA from a number of different sensors, including MODIS and Landsat. The data covers a number of small and big fires globally at a decadal temporal scale. The majority of this imagery is georectified (has a location associated with the image) and has been processed appropriately for this project. Additionally, two time series image sets were collected. One set was of a fire in Africa, demonstrating the spread of the fire over time and how it moved and changed direction. The other time series covers approximately 20 years of burns and recovery in Yellowstone National Park with yearly imagery. Both these time series have been successfully analyzed and animated, as shown here.
Following project developments, additional data was collected in the form of Google Earth imagery GIFs which demonstrated change in land use over time. These collections were used to assess the capabilities of machine learning across a wider range of landscape change phenomena, including deforestation of the Amazon and the growth of a coal mine. High-quality results were extracted from this data, indicating that machine learning has significant potential when batch processing remotely sensed imagery. This project found that for low-quality sets of remotely sensed imagery, machine learning can provide a practical and rapid analysis solution.

All scar images, before and after analysis (machine learning)

Vegetation recovery at Yellowstone National park ’89-’10


Coal Mine Growth


Manmade islands (Dubai)


Amazon deforestation


Project Steps
- Collect as much data as is possible within the current time constraints. If the process is seen to work, it may be worthwhile to expand the data collection, in particular towards obtaining time series image collections, as temporal analysis has the potential to provide valuable ecological data. All easily accessible data has been acquired (July 5, 2014), and acquiring further data would be very time-consuming, although potentially beneficial later in the process.
- Images are to be imported into Mathematica. Initially the focus is going to be on analyzing images individually to work out what the most efficient formula is for the extraction of the burn scar. On initial investigation, it appears that this will involve many of the image processing tools (MeanShiftFilter[image, r, d] and WatershedComponents[image]). If the built-in functions do not have a sufficient capacity to recognize the shapes, it may be necessary to look at the values of individual pixels and their nearest neighbors to obtain more accurate scar mapping, and where true and false color images are available, comparison between pixels (and therefore bands) may also yield higher-quality data. To extract the burn scar as an image/shape, it is likely that image masks will be created for each file, unless another option becomes apparent.
- Additionally, it should be noted that as these images cannot be ground truthed and no calibration or validation data is available, the majority of quality assurance will rely on personal experience with satellite imagery and burn scars.
- Once the appropriate function for extracting the burn scar has been found and successfully applied, it will be necessary to develop a system for classifying, describing, and comparing the scars. This will be achieved by looking through the literature to investigate any standards of best practice and, where appropriate, by a visual assessment of the shapes. From an initial glance through the raw images it appears that there are some distinct shapes and patterns, the clearest being straight lines where roads have been used as a firebreak, which although not a natural occurrence does indicate some styles in fire fighting (July 5, 2014).
- Images are to be analyzed en masse. To achieve this efficiently it will be necessary to automatize the processes as worked out in step 2. Essentially, images will be imported and analyzed, and the burn scar will be extracted and then saved in a common format in a gallery with all other burn scar shapes.
- Burn scar shapes are then to be compared en masse to look for general global patterns and then more specific patterns, for example, continental, hemispheric, or environmental. To achieve this, geo tools will be applied, initially based on knowledge about fire behavior (for example, the importance of wind/temperature conditions) and where time allows looking for other more “creative” relationships, depending on the data available (e.g. population density, urban sprawl). It would also be interesting to look at other information related to these fires, for example, length of burn, fatalities, and number of people deployed to the fire related to the shapes and general geo data.
- Finally, information will be written up as appropriate to communicate the findings of this project.
References
- Image Libraries
- USGS Landsat imagery
- NASA Earth Observatory Imagery (Bushfires)
- Yellowstone Time Series Data fire information
- Managing fire in Etosha imagery and information
- North Australian Fire Information (NAFI) Archives
- General Knowledge
- Literature
- Mohler, R. L. and D. G. Goodwin. “A Comparison of Red, NIR, and NDVI for Monitoring Temporal Burn Signature Change in Tallgrass Prairie.” Remote Sensing Letters 1, no. 1 (2010): 3–9.
- Quintano, C., et al. “Estimation of Area Burned by Forest Fires in Mediterranean Countries: A Remote Sensing Data Mining Perspective.” Forest Ecology and Management 262, no. 8 (2011): 1597–1607.
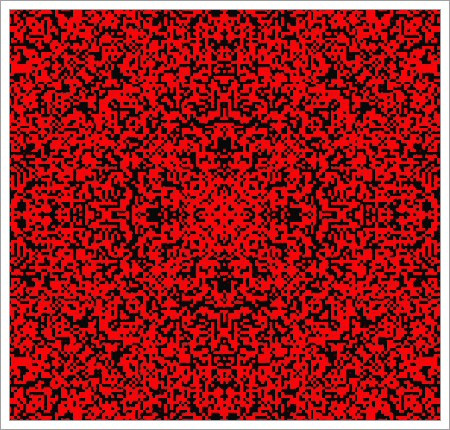
Favorite Outer Totalistic r=1, k=2 2D Cellular Automaton
Rule 123499