Alumni
Anwesha Das
Bio
Anwesha Das is a rising junior at Delhi Public School Kalyanpur, Kanpur, India. She loves mathematics, and spends a major part of her time pursuing the subject. Her other passion is cognitive/social psychology research. Because of her research, she has been lucky enough to participate in several science fairs, and even give two TEDx talks. She recently started a blog, accompanied by a club at her school (starting this academic year), InnovatiON, to promote research and innovation amongst children, and dreams of starting the first science fair of her district. In college, she plans to major in mathematics and computer science, with psychology as a minor. In addition to this, she likes writing on her personal blog, editing for ‘Polyphony Lit’ and ‘Muse’ and painting on walls and rocks. However, she is still pretty clueless about the World Cup or K-pop, but loves blackcurrant ice-cream.
Project: Analysing Global Emoji Usage
Goal
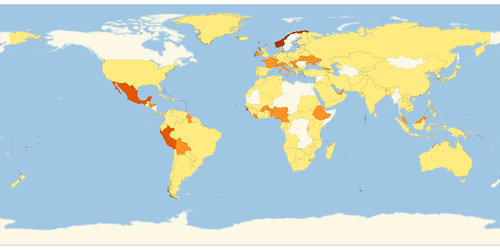
Emojis, over time, have become an important form of expressing emotions, especially in the social media world, for example Twitter. The main aim of this project was to explore which emojis are dominantly popular in a specific geographic area. The first step was to get Twitter data based on a geographic region (country), followed by extracting the emojis. Further, emoji usage density (i.e. number of emojis per tweet) was plotted for each continent and the most common emoji was calculated for each country. A side exploration was to investigate any possible correlation between GDP and emoji usage and literacy rate and emoji usage.
Summary of Results
In this project, around 220 000 tweets from 226 countries were used. The "tears of joy" emoji was found to be the most popular globally, in addition to being the most used for 104 countries. This was followed by the "crying loudly" emoji! Unfortunately, no clear trend was observed for the GDP versus emoji usage plot. However, for the literacy fraction versus emoji usage, a positive trend was observed, i.e. emoji usage goes up as the literacy fraction goes up.
Future Work
One interesting extension of the project could be to explore how the first/official language of a country affects its emoji usage patterns. A possible approach is to try and find a correlation between alphabet length (e.g. 26 characters for English) and emoji usage density.