Alumni
Mukilan Karthikeyan
Bio
Mukilan is going to be a Sophomore this fall at Morris Hills High School in Rockaway, New Jersey. So far he has taken Algebra II and has some experience with Python, the Wolfram Language, and HTML. He is fascinated by physics and philosophy, especially the concept of time. His interest in philosophy has led to a goal of one day creating a general artificial intelligence. Apart from tackling new concepts in math, science, or technology, Mukilan is also part of the school's varsity chess team, is interested in film production, and loves playing the piano.
Project: Visualizing the Fourier Series for Curves
Goal
The goal of the project is to enable the user to visualize the Fourier series for a function or a 2D curve with nth degree accuracy. There will be two parts to the project concerning the inputs given. The first will allow the user to input a function and create a visualization of a Fourier series that creates a graph approximately close to the given function. The second option is to input an image and get back a visualization of the process and generate a pair of Fourier series that generates the given curve in a 2D plane. For the image, I will use image processing in order to pull out a curve and then use it to give them back a result. With both inputs, the user will be able to specify the accuracy of the resulting Fourier series.
Summary of Results
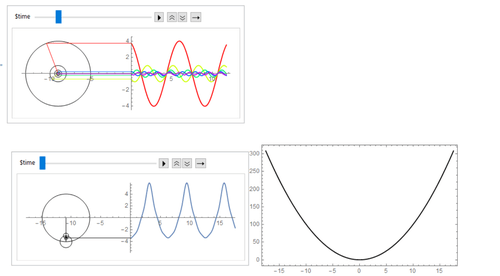
Through the process of creating a function, I went through multiple iterations and three different approaches to create the visuals. Since this project involved higher-level math, I spent the first day learning the topic and learning calculus and trigonometry. My first function was to input the function into the built-in function FourierSeries and tried to generate the circles. Although it initially worked, more testing proved that only a select number of functions worked and it mattered on the type of function. In order to take smaller steps, I used FourierCosCoefficient to artificially generate the sequence for even functions. I then realized that multiple helper functions were not ideal and that I would need to display the circle chain drawing the approximated function. I again tried to tackle a smaller problem before I moved on and created a function that would center all the circles at one point and would display all the smaller frequencies that were summed in order to generate the approximation. Next I used the formatting to create the chain of circles. When this was finished, I had two days left, and so with the even functions finished, I changed a few lines to adapt them to the odd functions. Throughout this entire journey, I ran into many locked doors and sometimes walls, so I had to change my approach to the problem. Right now, my final project is creating a visualization for any odd or even function.
Future Work
In the future, when I have more time, I hope to get the function to create a visualization for any function even if it is neither odd nor even. By doing so, I will be able to draw any curve that is provided using rotating arm segments. The end goal is to create a function, such that if given any picture of a curve, it will recreate the curve using a series of circle linkages. Finally, I will cloud deploy the functions so that there will be a mini site that is easy for users to access and utilize.